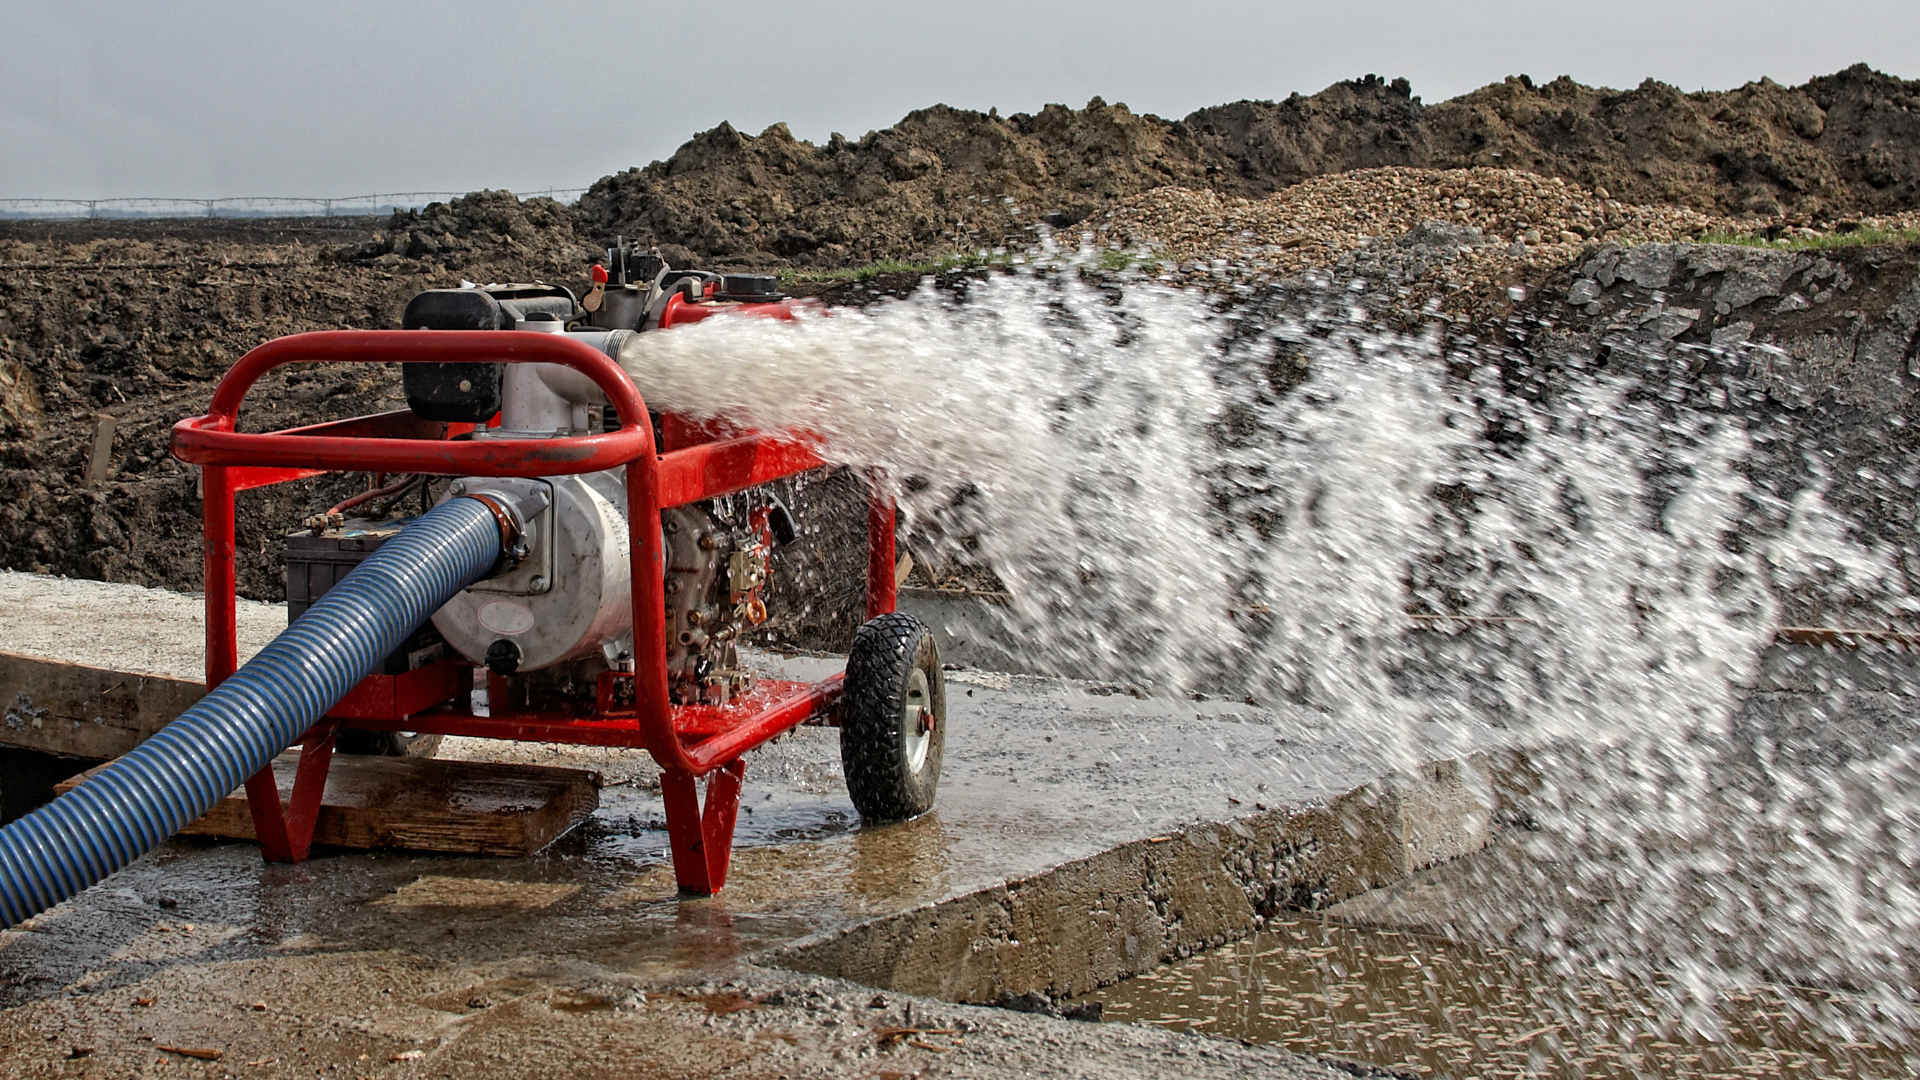
Dewatering Assessments, Built on Connected Field Data
Dewatering decisions depend on information collected across boreholes, laboratories, groundwater monitoring, and engineering teams. aQRate connects that data into one structured workflow — from field collection to assessment-ready outputs.
aQRate is the field data infrastructure behind the assessment — not a replacement for hydrogeological or engineering judgment.
Explore the Dewatering Assessment Demo →The Dewatering Assessment Is Only as Connected as the Data Behind It
Dewatering projects often involve several teams and several data systems. On many projects the workflow looks like this — each stage produces information, but the connections between them live in someone's inbox.
Field Logging
Drilling crews collect interval depths, USCS descriptions, SPT N-values, recovery, groundwater observations and location information.
Laboratory Results
Gravel %, sand %, fines % and other particle or index results arrive separately and are manually associated with the field records.
Borehole & Groundwater Data
Borehole logs are prepared separately while groundwater monitoring data — pumping well, observation wells, measurements — is collected independently.
Assessment & Reporting
Hydrogeological teams transform the collected information into hydrographs, contours, drawdown visualizations and assessment outputs.
The problem is not simply collecting more data.
It is preserving the connection between the data throughout the workflow — from the borehole interval to the laboratory result to the groundwater measurement that ends up in the assessment. This is the workflow problem aQRate is designed to address.
One Workflow From Borehole to Dewatering Assessment
The same record moves through every stage — no re-entry between steps. Select a step to follow one field observation through the workflow.
Step 1 — Investigate: Capture borehole and subsurface information directly in the field.
Capture the Data the Assessment Depends On
Four record types, one schema. Open a category to see the fields the dewatering assessment template collects.
Subsurface
The interval-level record a driller or field engineer logs at the borehole, structured as it is observed.
Laboratory
7 fieldsGroundwater
7 fieldsProject Context
8 fieldsStart With the Dewatering Assessment Template
Start with a workflow designed around the data a dewatering assessment needs, then adapt it to your project's requirements — borehole and interval records, groundwater monitoring forms, lab analyses, the Dewatering Visualizations view and the Dewatering Technical Assessment report, with 365 sample records to explore.
Dewatering Assessment
Project ID*
Date*
Time*
Well ID*
Location*
Pumping Rate (L/min)*
Static GW Level (m bgs)*
Current GW Level (m bgs)*
Sample ID
Lab Analysis Required
Total Suspended Solids
Benzene
Dewatering Assessment
PRJ-HIGH-2026
2026-06-23T00:00:00.0000000Z
08:00:00
OW-4
53.56468, -113.43338
0
2.47
3.45904092669934
—
—
—
—
Report ready: Dewatering Technical Assessment
See the Subsurface and Groundwater Data Together
These are five views of one connected project dataset — the borehole logs, the site layout, the monitoring record, and the assessment views draw from the same records, not from re-typed copies. The borehole, groundwater and assessment views show data from the aQRate dewatering demo use case; the site plan is illustrative. Click any view to open it in the aQRate portal.
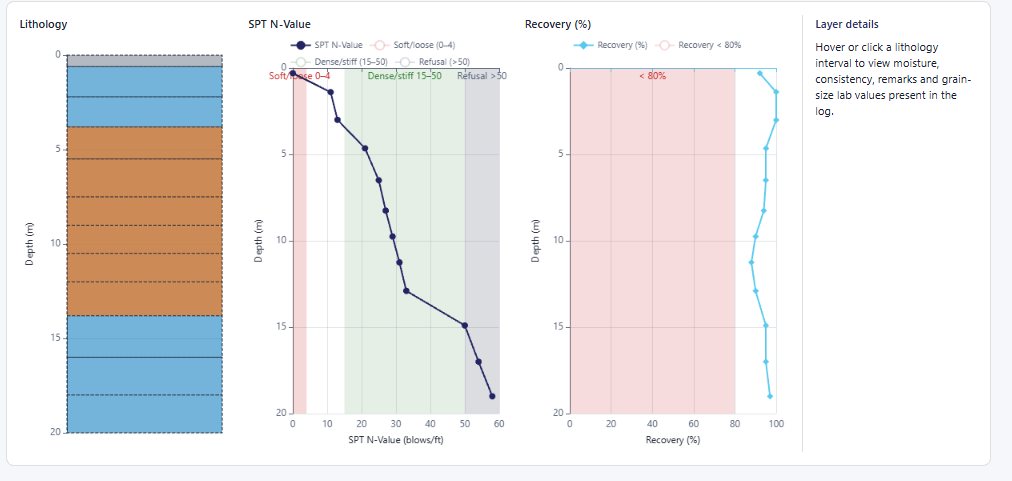
A 72-Hour Dewatering Assessment — From Field Data to Decision-Ready Outputs
A representative aQRate demonstration workflow — a demonstration of how a connected data workflow can support a dewatering assessment, not a universal assessment configuration. All figures below are demo data, not project measurements.
Demo configuration
2 detailed borehole logs
1 pumping well
4 observation wells
72 hours of groundwater-level monitoring
Physical water samples
Laboratory testing for TSS, Benzene and TPH
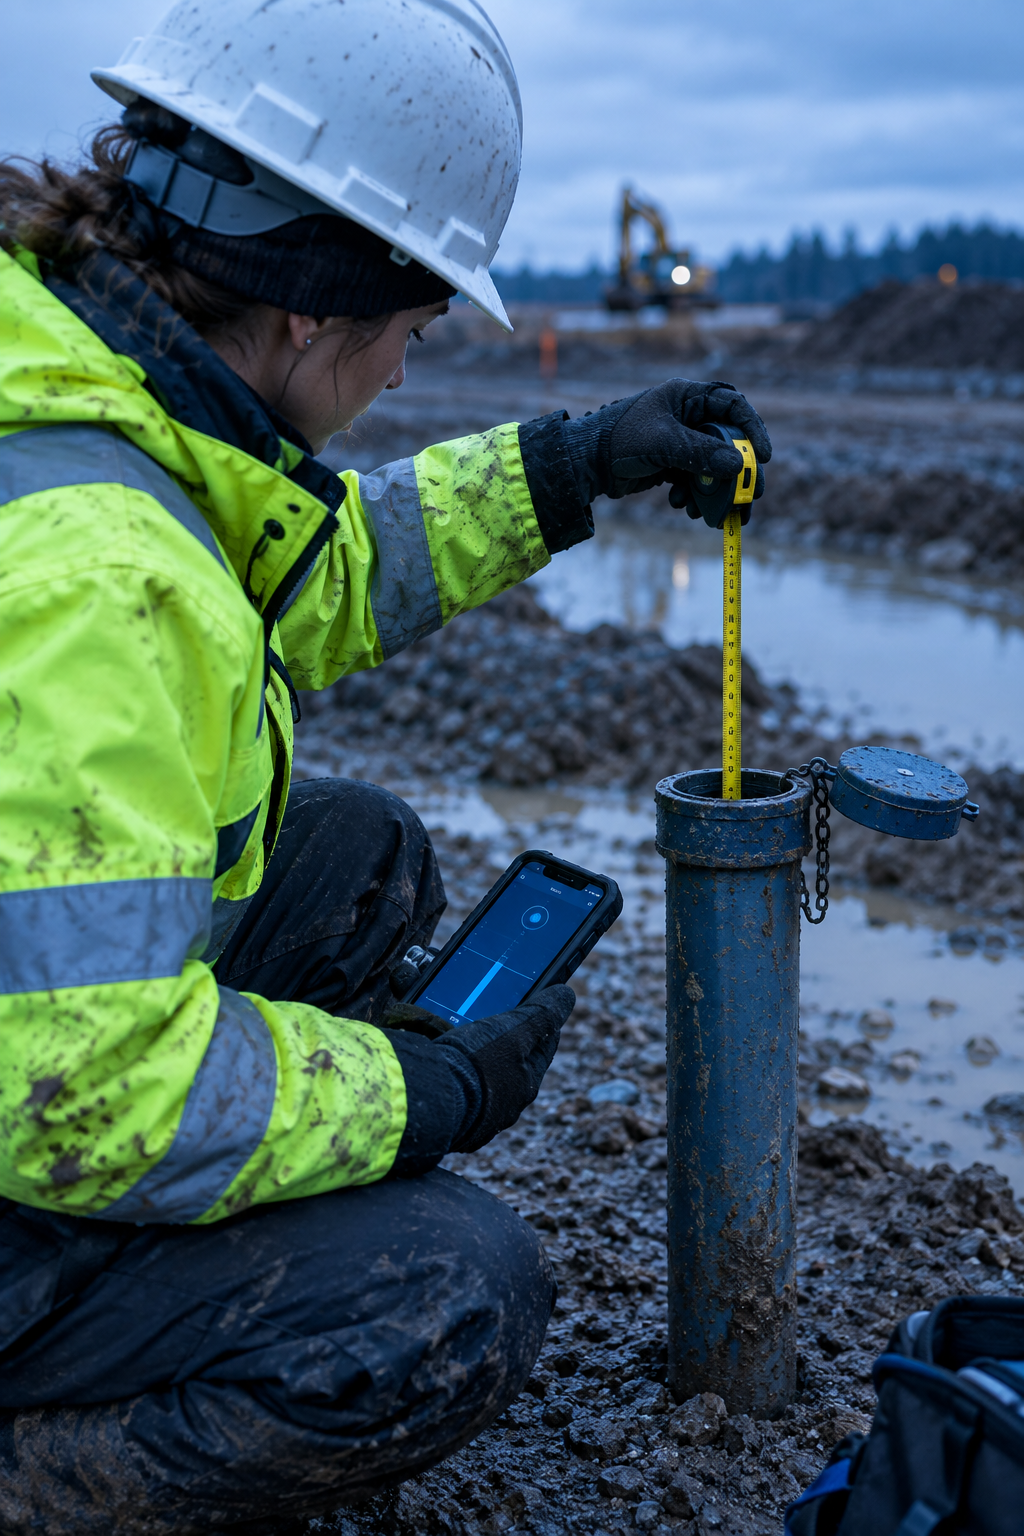
Groundwater levels — 72 hours of monitoring
Pumping well PW-1 and observation wells OW-1 to OW-4 (demo data)Water-sample laboratory results
TSS, Benzene and TPH results linked to the sample IDs they came from (demo data)Raw data
↓
Connected record
↓
Output
Built for Teams Managing Complex Groundwater Workflows
If your project involves subsurface investigation, groundwater monitoring, excavation and dewatering decisions, aQRate can provide the connected data layer behind the workflow. Not every organization runs the same workflow — forms and records adapt to how your teams already work.
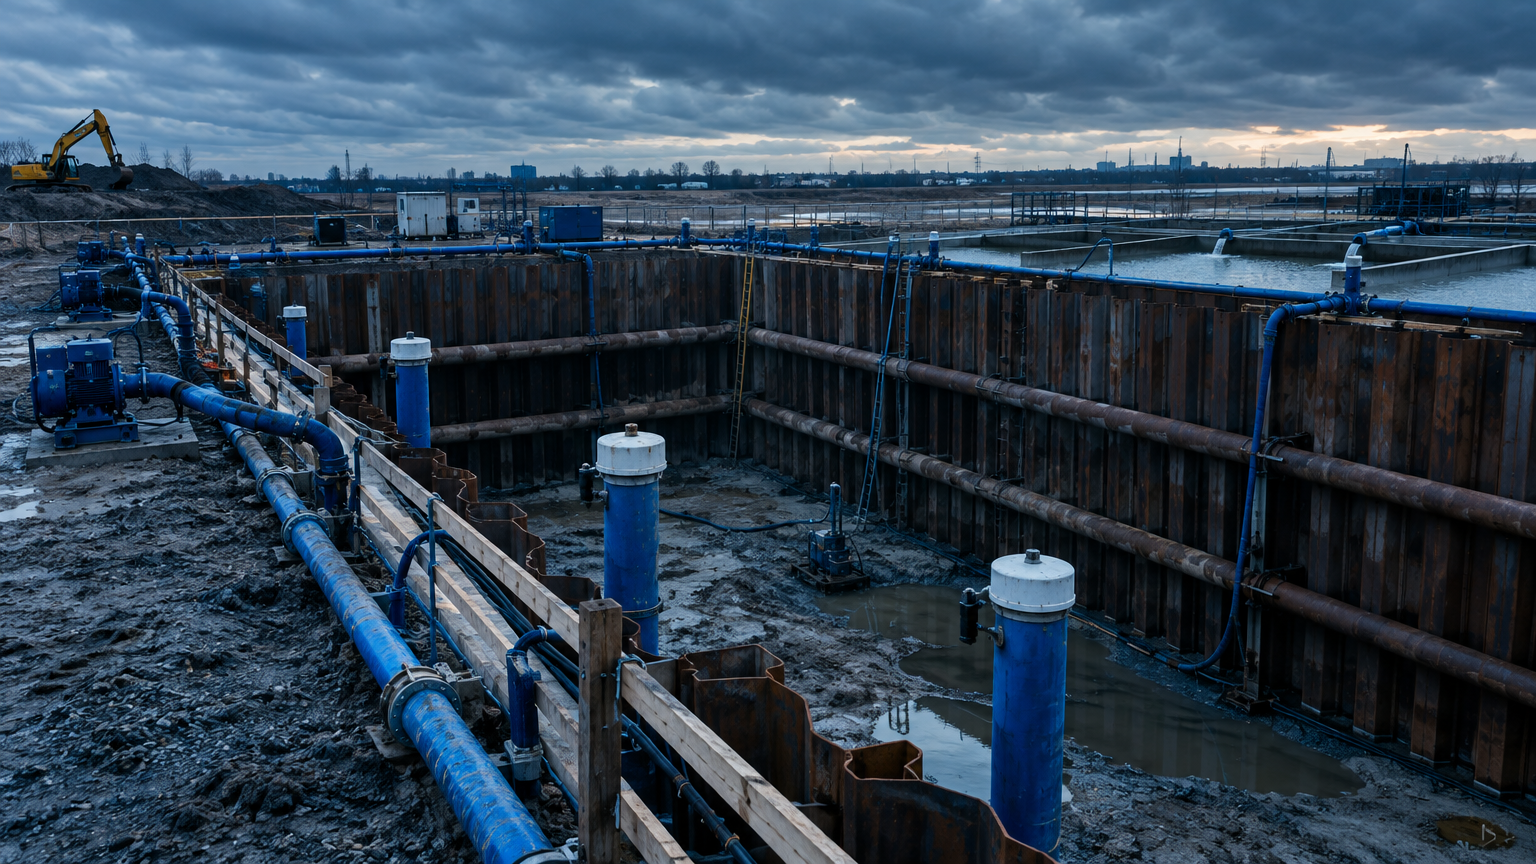 Real dewatering field conditions: pumping equipment, wellheads and an excavation where the monitoring record is made.
Less Data Handling. More Engineering-Ready Information.
The operational outcomes teams look for when the dewatering record is connected.
Less Manual Re-Entry
Reduce unnecessary copying of field and laboratory information between systems — the record is entered once, at the source.
Faster Reporting
Move from fragmented records toward reusable, structured project data and automated outputs like the Dewatering Technical Assessment report.
Better Traceability
Maintain relationships between observations, samples, measurements and final outputs — every chart traces back to a field record.
Reusable Data
Keep project data useful after the first assessment instead of rebuilding the dataset for every subsequent output.
aQRate product claim: aQRate can reduce reporting turnaround times by up to 50%, depending on workflow and implementation. This is an aQRate claim about the platform — not an independent industry statistic.
Frequently Asked Questions
An evaluation of groundwater conditions — typically supporting excavation or construction below the water table — that draws on borehole information, laboratory results and groundwater monitoring to inform pumping, drawdown and discharge decisions. aQRate manages and connects the data behind it; the engineering assessment itself remains the work of qualified professionals.
Borehole and subsurface observations (interval depths, USCS classifications, SPT N-values, recovery), groundwater monitoring (pumping and observation wells, groundwater elevations, timestamps), laboratory information (particle-size results, water-quality analyses), plus locations, project IDs and other project-specific measurements.
Yes. The Dewatering Assessment form captures well ID (PW-1, OW-1 through OW-4), pumping rate, static and current groundwater levels, date, time and location through configurable field forms and workflows — online or offline.
Yes. Sample IDs structured in the field — including lab analysis requirements like TSS, Benzene and TPH — are associated with the laboratory results that come back, so every result stays connected to the sample, interval and borehole it came from.
aQRate can generate configured visualizations from structured project data — including maps, groundwater trends, contours, heatmaps and drawdown visualization through views like Dewatering Visualizations, where implemented for your project.
No. aQRate is designed to manage and connect the field and project data feeding engineering workflows. Specialized modelling software and professional hydrogeological judgment remain part of the appropriate technical workflow.
Yes. Forms, records, relationships, reports and visualizations can be configured around your project's requirements — start from the Dewatering Assessment template and adapt from there.
Turn Your Dewatering Data Into a Connected Workflow
Stop rebuilding the same project data across spreadsheets, field notes, laboratory records and reports. Connect the workflow from field collection to assessment-ready outputs with aQRate.
The template creates a new aQRate workspace with the Dewatering Assessment workflow already configured. aqrate.ca